2019 Data Sources & Study Methods
2017 Data Sources & Study
2015 Data Sources & Study Methods
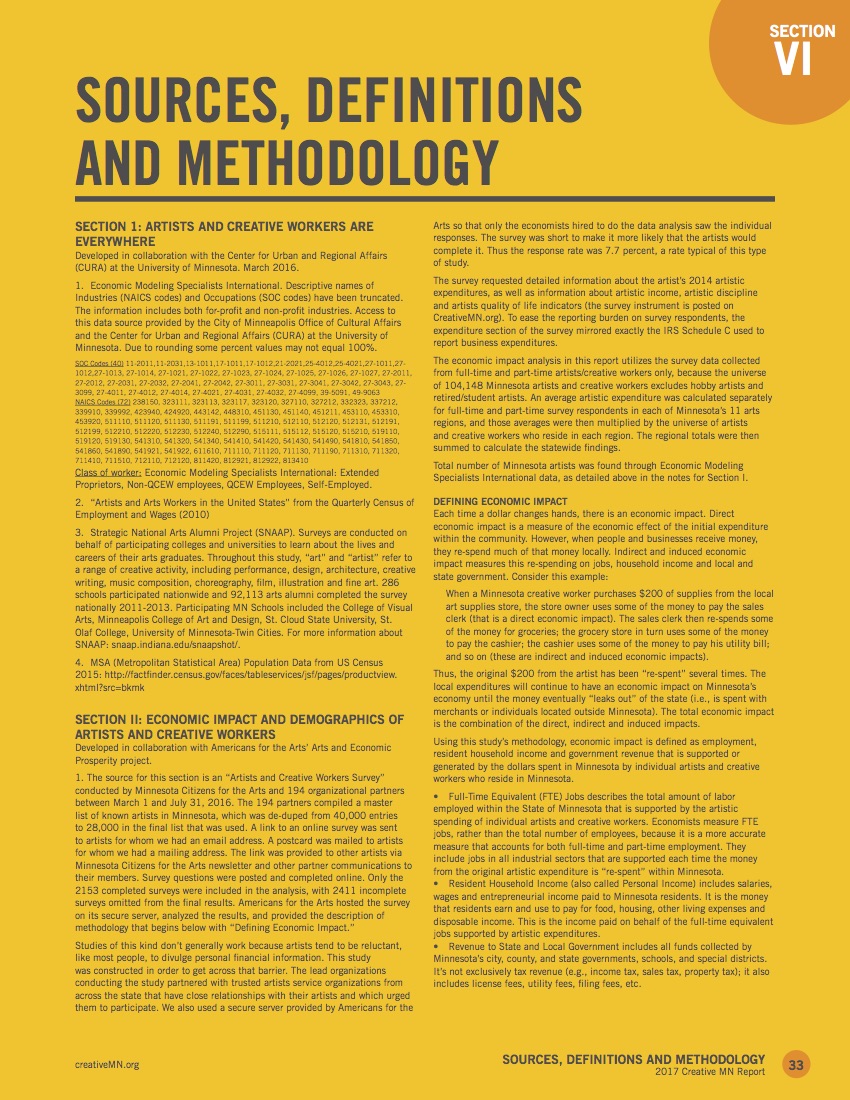
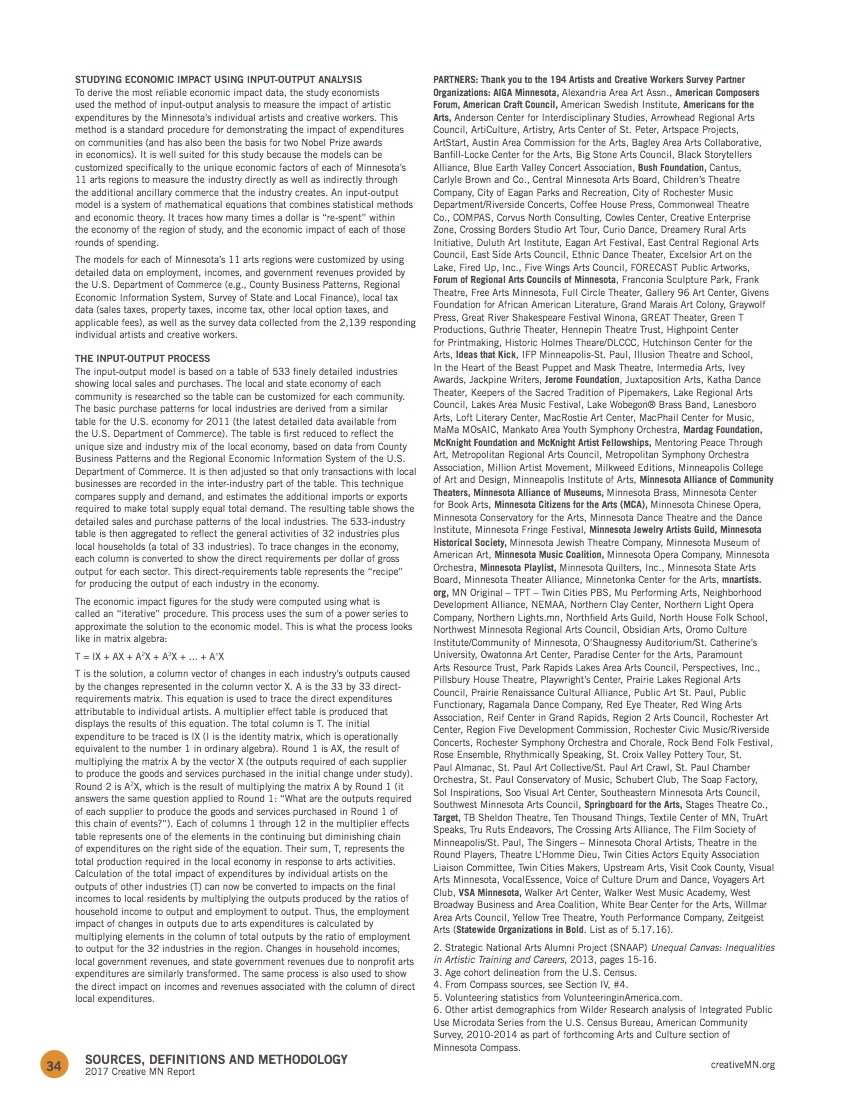
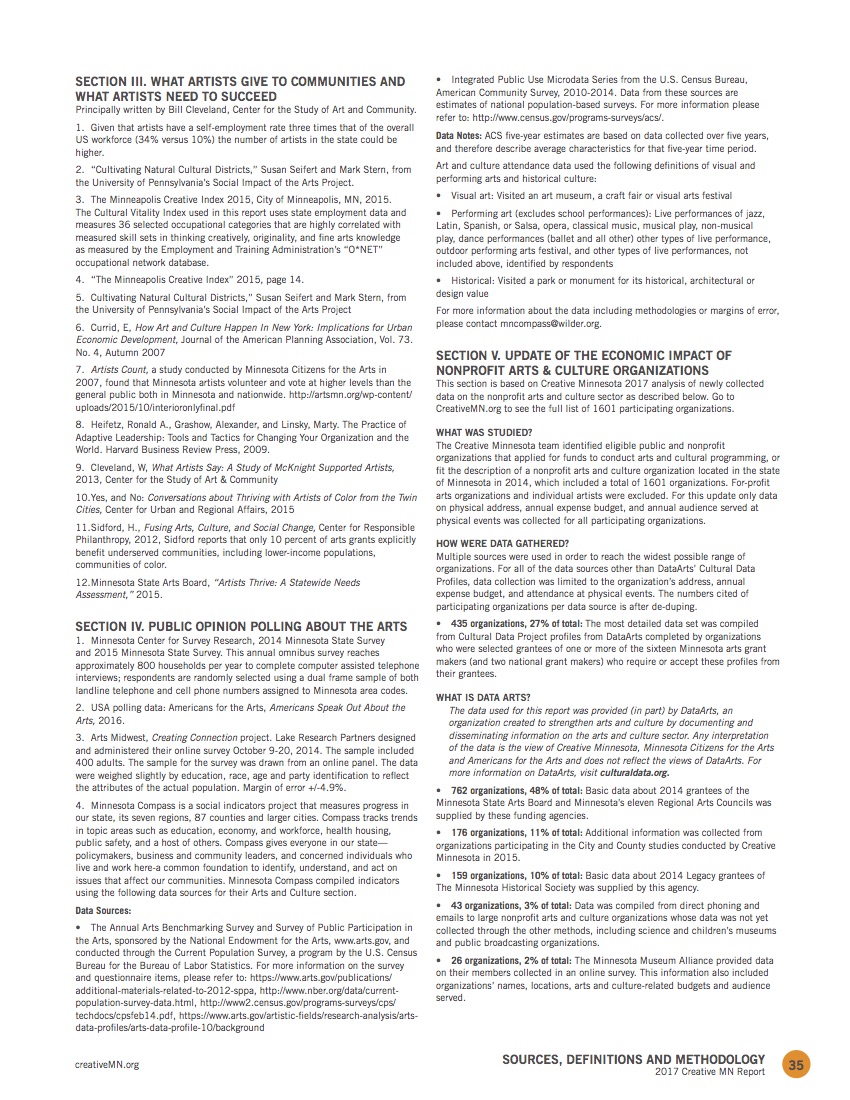
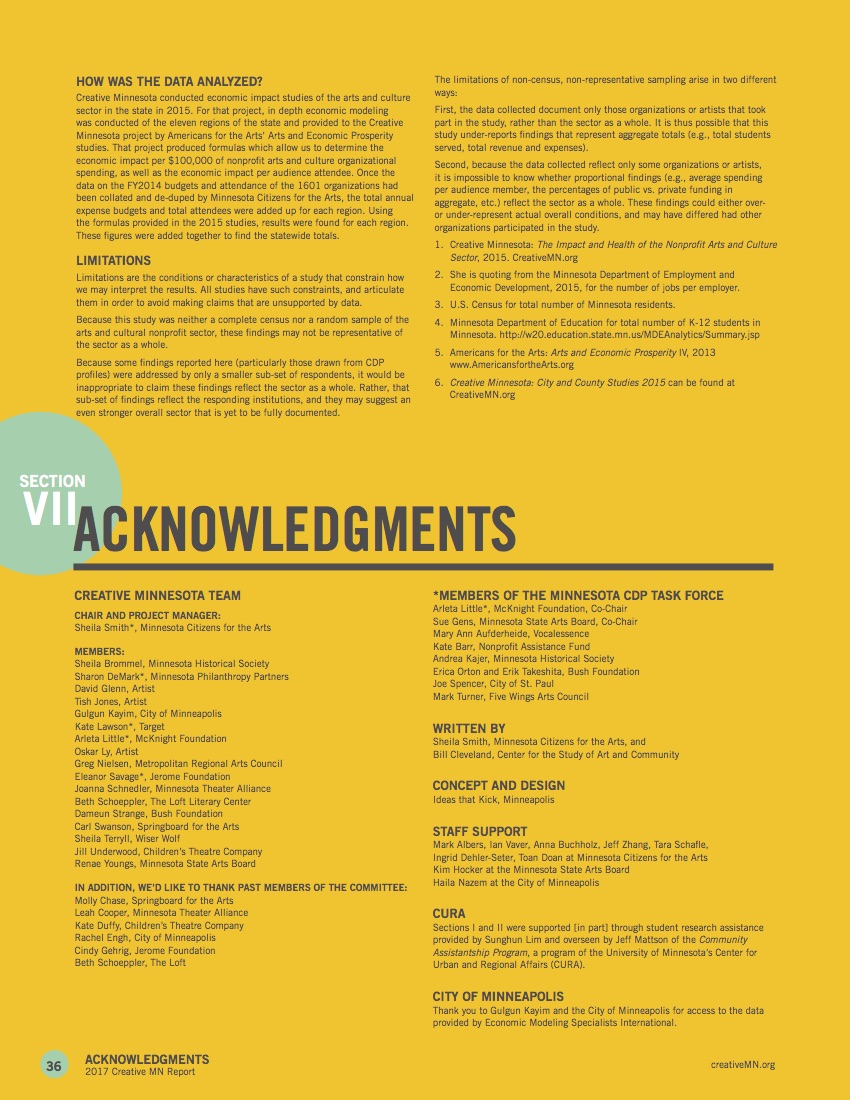
(1) Unless otherwise noted, the source of the data in this report is Arts & Economic Prosperity® IV: The Economic Impact of Nonprofit Arts and Culture Organizations and Their Audiences in the State of Minnesota, Americans for the Arts, 2014, and the associated 2014 eleven regional Minnesota studies. These studies relied on Cultural Data Project (CDP) data in addition to an online nonprofit arts and culture organization survey, grantee data provided by the Minnesota State Arts Board, Regional Arts Councils and Minnesota Historical Society and audience surveys.
(2) Source: CDP Data, supplemented by an online survey of Minnesota arts organizations and grantee data from the Minnesota State Arts Board, Regional Arts Councils and Minnesota Historical Society.
(3) Source: Cultural Data Project (CDP) data. The CDP is a national data collection and reporting designed to strengthen the performance, vitality, and impact of the arts and culture sector. Many public and private grant makers in Minnesota require some or all of their arts and culture grantees to submit data to the CDP as part of their application process. Most CDP data is financial, though it includes information about services provided, numbers of participants, staffing and volunteers as well. CDP data in this report is from arts nonprofits as they reported it to the CDP.
(4) Source: 2013 Cultural & Heritage Traveler Study by the Tourism Marketing Council.
(5) Source: MN Tourism 2013 Annual Report
(6) Source: Minnesota Dept. of Education, http://w20.education.state.mn.us/MDEAnalytics/Summary.jsp
(7) Source: National Endowment for the Arts, Artists and Arts Workers in the United States: Findings from the American Community Survey (2005-2009) and the Quarterly Census of Employment and Wages (2010)
(8) Source: Minnesota Dental Board, 2013 data
WHAT WAS STUDIED?
The Creative Minnesota team identified eligible public and nonprofit organizations that applied for funds to conduct arts and cultural programming, including a total of 4,779 organizations. For-profit arts organizations and individual artists were not part of this study. For sampling and study methods consult source (1) above.
HOW WERE DATA GATHERED?
Multiple sources were used in order to reach the widest possible range of organizations; some of the questions asked across data sources were identical, while others were asked in some data sets but not others. In all, data were collected from 1,269 organizations, or 26.6% of the possible study population.
The most detailed data set was compiled from Cultural Data Project (CDP) profiles completed by organizations who were selected grantees of one or more of the thirteen Minnesota arts grant makers (and four national grant makers) who require or accept these profiles from their grantees. This created a total data set of 298 from this source, which reflects 23.5% of all organizations reached in the study and represents 6.2% of the possible study population.
In addition, basic data about all other 2012 grantees of the Minnesota State Arts Board, Minnesota Historical Society and Minnesota’s eleven Regional Arts Councils were supplied by these funding agencies for an additional group of 575 data points. This information included organizations’ names, locations, arts and culture-related budgets, and audience served.
A third data set was compiled from an online survey described in source (1) above. A total of 396 respondents opted into participation in this survey, creating a non-random sample that comprised 31% of responses in the study. One large organization that did not complete a CDP profile instead completed a more detailed version of this survey that was comparable to the CDP profile.
A sample of arts and cultural event audiences around Minnesota were also asked to complete a questionnaire between April and July 2014. Source (1) above describes this process in more detail. History-related events comprised 10% of events where audience data were gathered; a total of 3,410 audience questionnaires were collected. Sampling of individual respondents was not necessarily random, so these data may not reflect overall arts and cultural audiences.
Additional information from secondary sources is referenced in this report to illustrate related topics (i.e., statistics about individual artists, artist employment, and inter-state tourism). These topics inform but were not central to the present study.
CULTURAL DATA PROJECT:
The data used for this report was provided (in part) by the Cultural Data Project (“CDP”), an organization created to strengthen arts and culture by documenting and disseminating information on the arts and culture sector. Any interpretation of the data is the view of Minnesota Citizens for the Arts, CliftonLarsonAllen and Americans for the Arts and does not reflect the views of the Cultural Data Project. For more information on the Cultural Data Project, visit www.culturaldata.org.
LIMITATIONS
Limitations are the conditions or characteristics of a study that constrain how we may interpret the results. All studies have such constraints, and articulate them in order to avoid making claims that are unsupported by data.
Because this study was neither a complete census nor a random sample of the arts and cultural nonprofit sector, these findings may not be representative of the sector as a whole.
Because some findings reported here (particularly those drawn from CDP profiles) were addressed by only a smaller sub-set of respondents, it would be inappropriate to claim these findings reflect the sector as a whole. Rather, that sub-set of findings reflect the responding institutions, and they may suggest an even stronger overall sector that is yet to be fully documented.
The limitations of non-census, non-representative sampling arise in two different ways:
First, the data collected document only those organizations that took part in the study, rather than the sector as a whole. It is thus possible that this study under-reports findings that represent aggregate totals (e.g., total students served, total revenue and expenses).
Second, because the data collected reflect only some organizations, it is impossible to know whether proportional findings (e.g., average spending per audience member, the percentages of public vs. private funding in aggregate, etc.) reflect the sector as a whole. These findings could either over- or under-represent actual overall conditions, and may have differed had other organizations participated in the study.
PHOTO CREDITS
Front Cover (in order of appearance left to right): Credit: Scott Streble; Credit: Minneapolis Green Central School Mural by Greta McLain; Courtesy of the MacPhail Center for Music, Photo by Kris Drake; Credit: Ananya Dance Theatre, Photo by V. Paul Virtucio Inside Front Cover: Courtesy of Minneapolis Institute of Arts Page 2/6: RAC 3 image credit: Ana Hagedorn; RAC 4 image credit: Michael Menconi being assisted by Evan Schauss during the Blow Your Mind workshop with Charles Lowrie, funded by a 2010 Arts Activities grant from MRAC; RAC 10: Courtesy of the MacPhail Center for Music Page 7: Credit: Children’s Theatre Company Page 8-9: Aparna Ramaswamy of Ragamala Dance Company, photographed at the National Centre for Performing Arts, Mumbai Page 11: Taming of the Shrew, photo by Wes Bailey for the Myles Reif Performing Arts Center Back Cover: Credit: HOBT and Bruce Silcox Photography
 Facebook
 Instagram
 YouTube
 Twitter
 Home Page